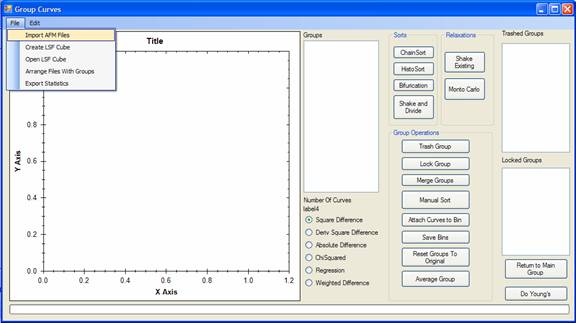
To start you must import your AFM files into the program. To do this, you must select the folder where the curves reside. One experiment per folder. Click File, and then Import AFM Files.
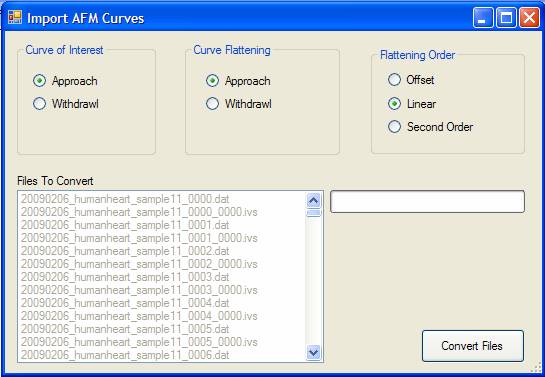
Now you must specify how you wish to compare the curves, i.e. on the approach or with the withdrawl. (Set Curve of interest to get this information). Next you must specify how you would like to flatten the curves to zero force, once again approach or withdrawl and then specify what order flattening to apply. Click convert files.
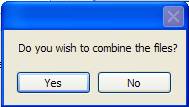
If you have Labview Dat files in the same folder as the AFM files, the program will ask if you wish to combine the files
The program will then convert all the files to the correct format in the same folder.
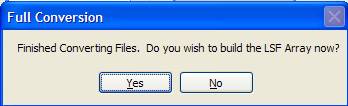
You will then be asked if you wish to build the LSF array. This is the correlation matrix for all the files, if you specify yes the array will be built at this point. Be aware that this takes a long time. You should go home and sleep for a large dataset.
Once the dataset is built, it will be saved to the same folder as an LSF file, to be reopened as desired.
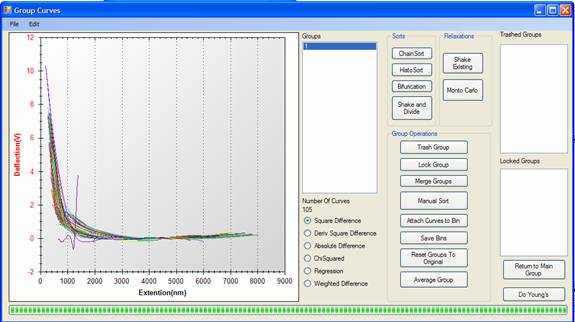
You should now click on the number if Groups to see a representative sampling of the curves. Now it is time to sort the curves into their groups. Click on either Chain Sort, HistoSort, Bifurication, or Shake and Divide to separate the groups. A sorting of the curves will be attempted in the program and then you can review the results. It is possible to try to improve the separations by using the Relaxation buttons. Shake will just put the curves in the best guess folders, and Monto Carlo will add a little randomness to the program to try to solve local minimal.
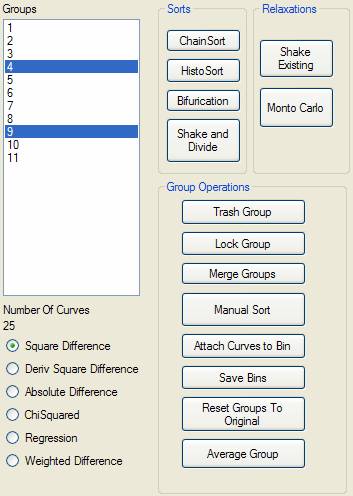
Once the automatic sorts are done, it is usually nessacary to do some sorts by hand. If a group is useless then select it in the Group listbox and click the Trash Group button. If a group is perfect and you do not wish to update it further, click the Lock Group Button.
Often the program will split two groups that are very similar, you can remedy this by selecting the similar groups and then using the Merge Groups button.
Last, you can manually sort the curves one at a time.
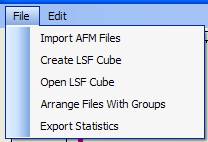
To save the manipulations, click Arrange Files with Groups and then the files will be physically sorted into their respective groups in a subfolder of the original folder.
If you just wish for a listing of where the files should go,
click 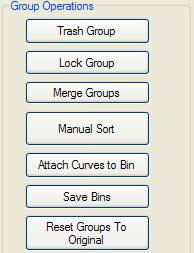
Save Bins to get a text file of all the statistics and filenames sorted accordingly.
Last you may wish to start over and get a better start. Use Reset Groups to Original.
You may also wish to get a representative curve of the group. The Average Group button will average all the curves in the selected group and give a representative curve and the standard deviation.